INFOGRAPHICS
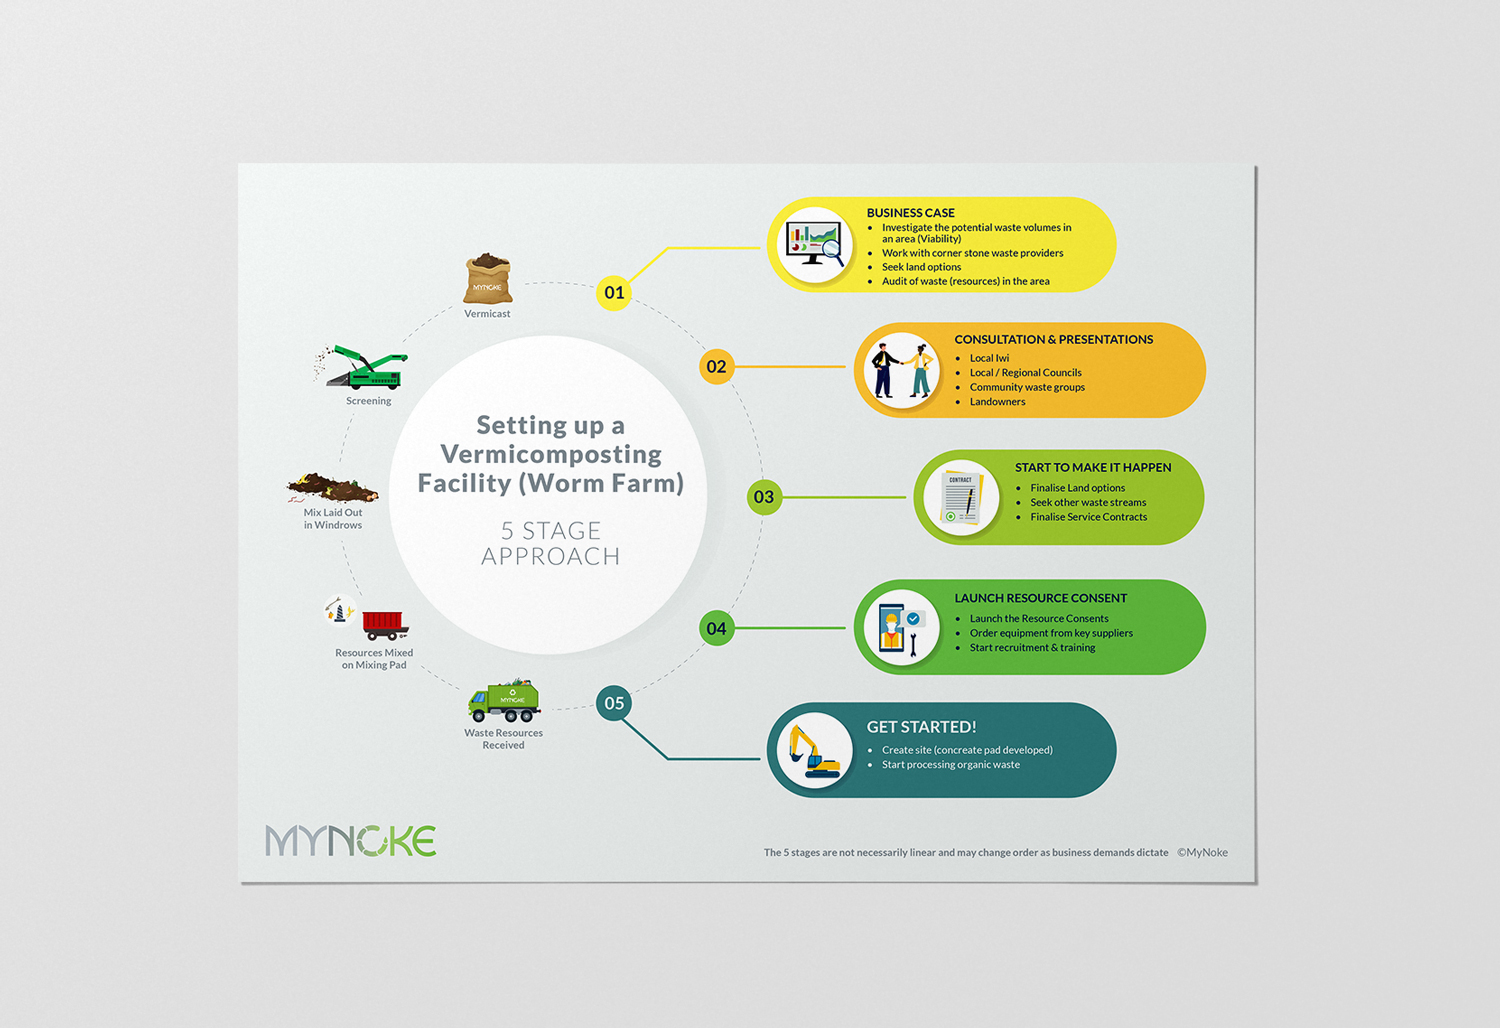
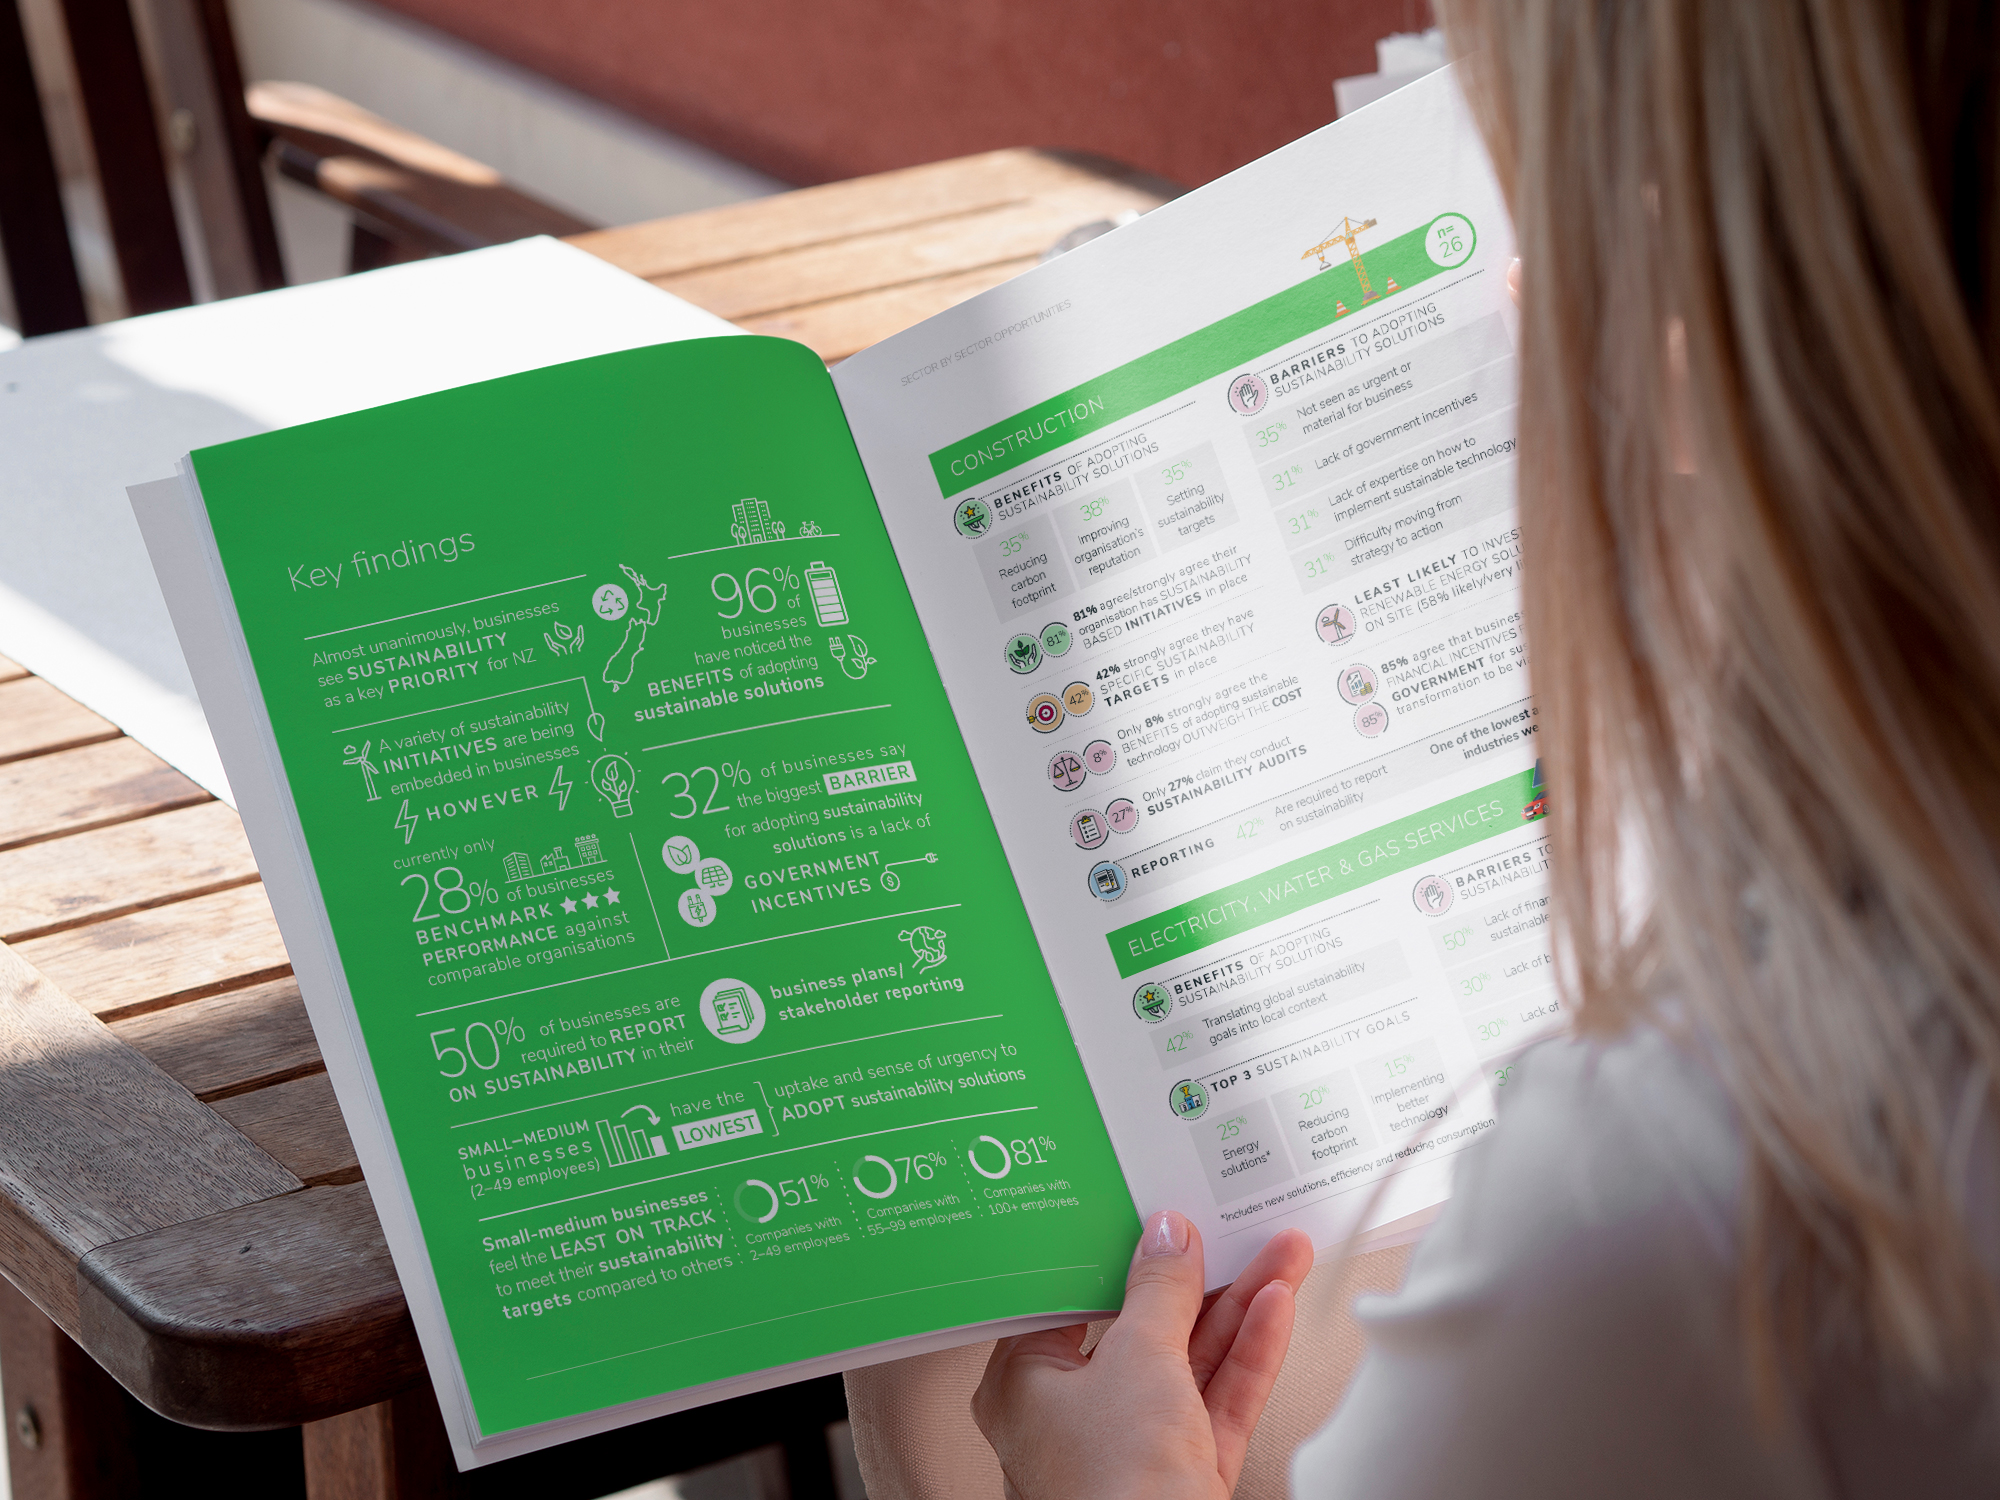
I really enjoy putting together infographics. There is something very rewarding about taking lines of data, sorting through the most important information and then presenting this in an appealing and easy to follow format.
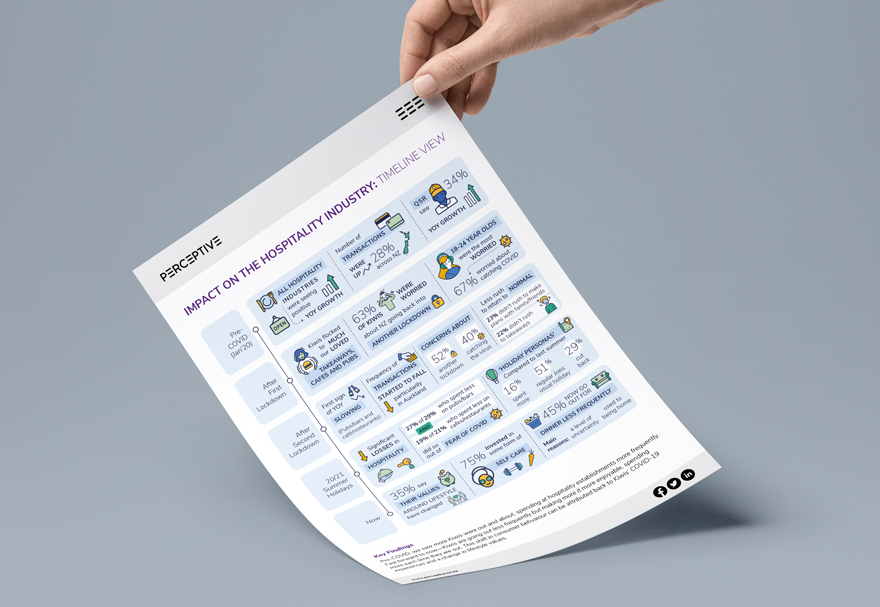
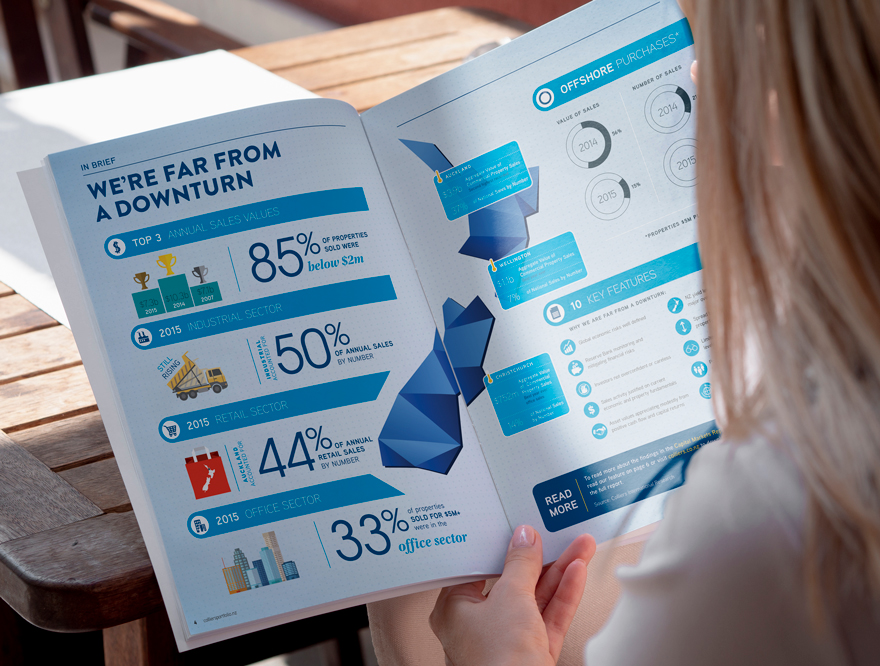
Hospitality Industry Spending: Post covid, there was a unique opportunity to look at perceived outlooks on spending compared to actual, anonymised spending data. This infographic served as a summary of these findings and a promotional piece for the larger report.
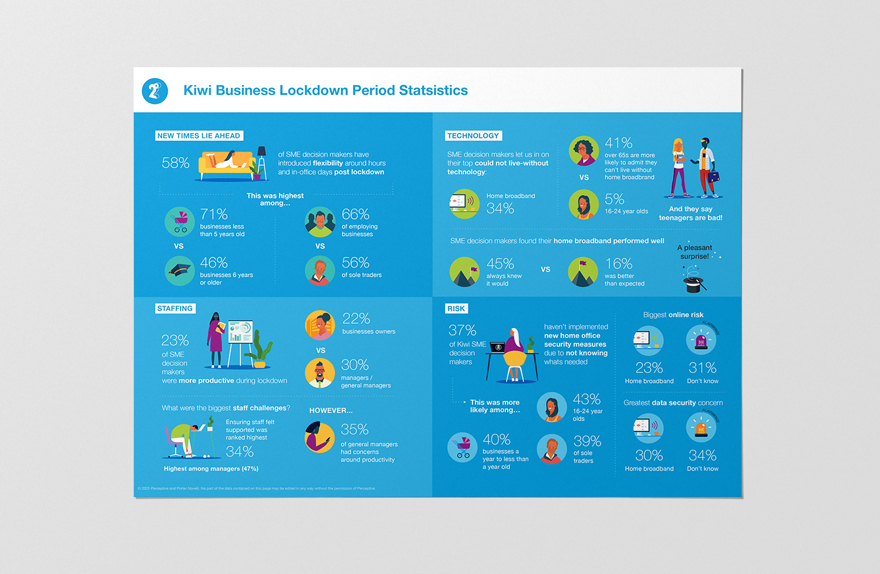
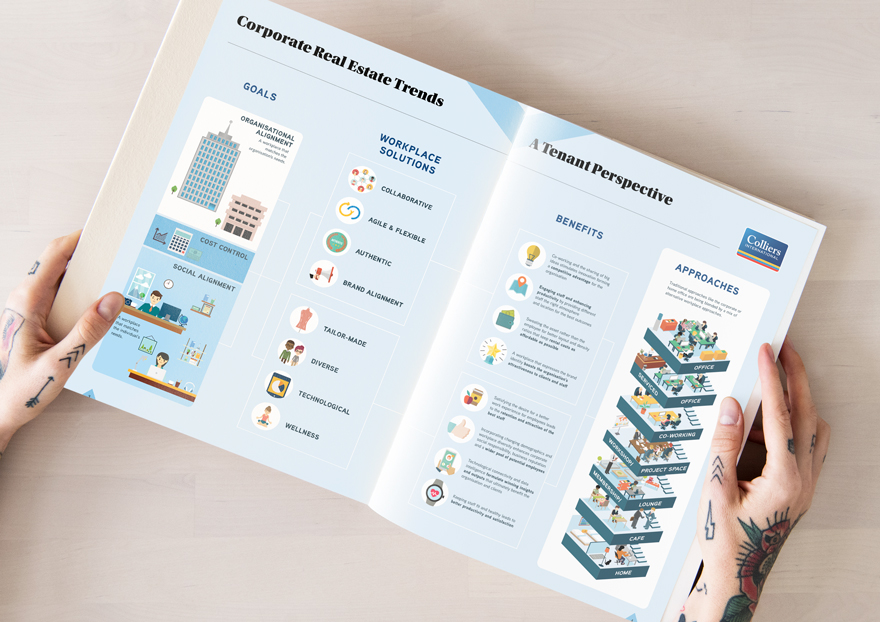
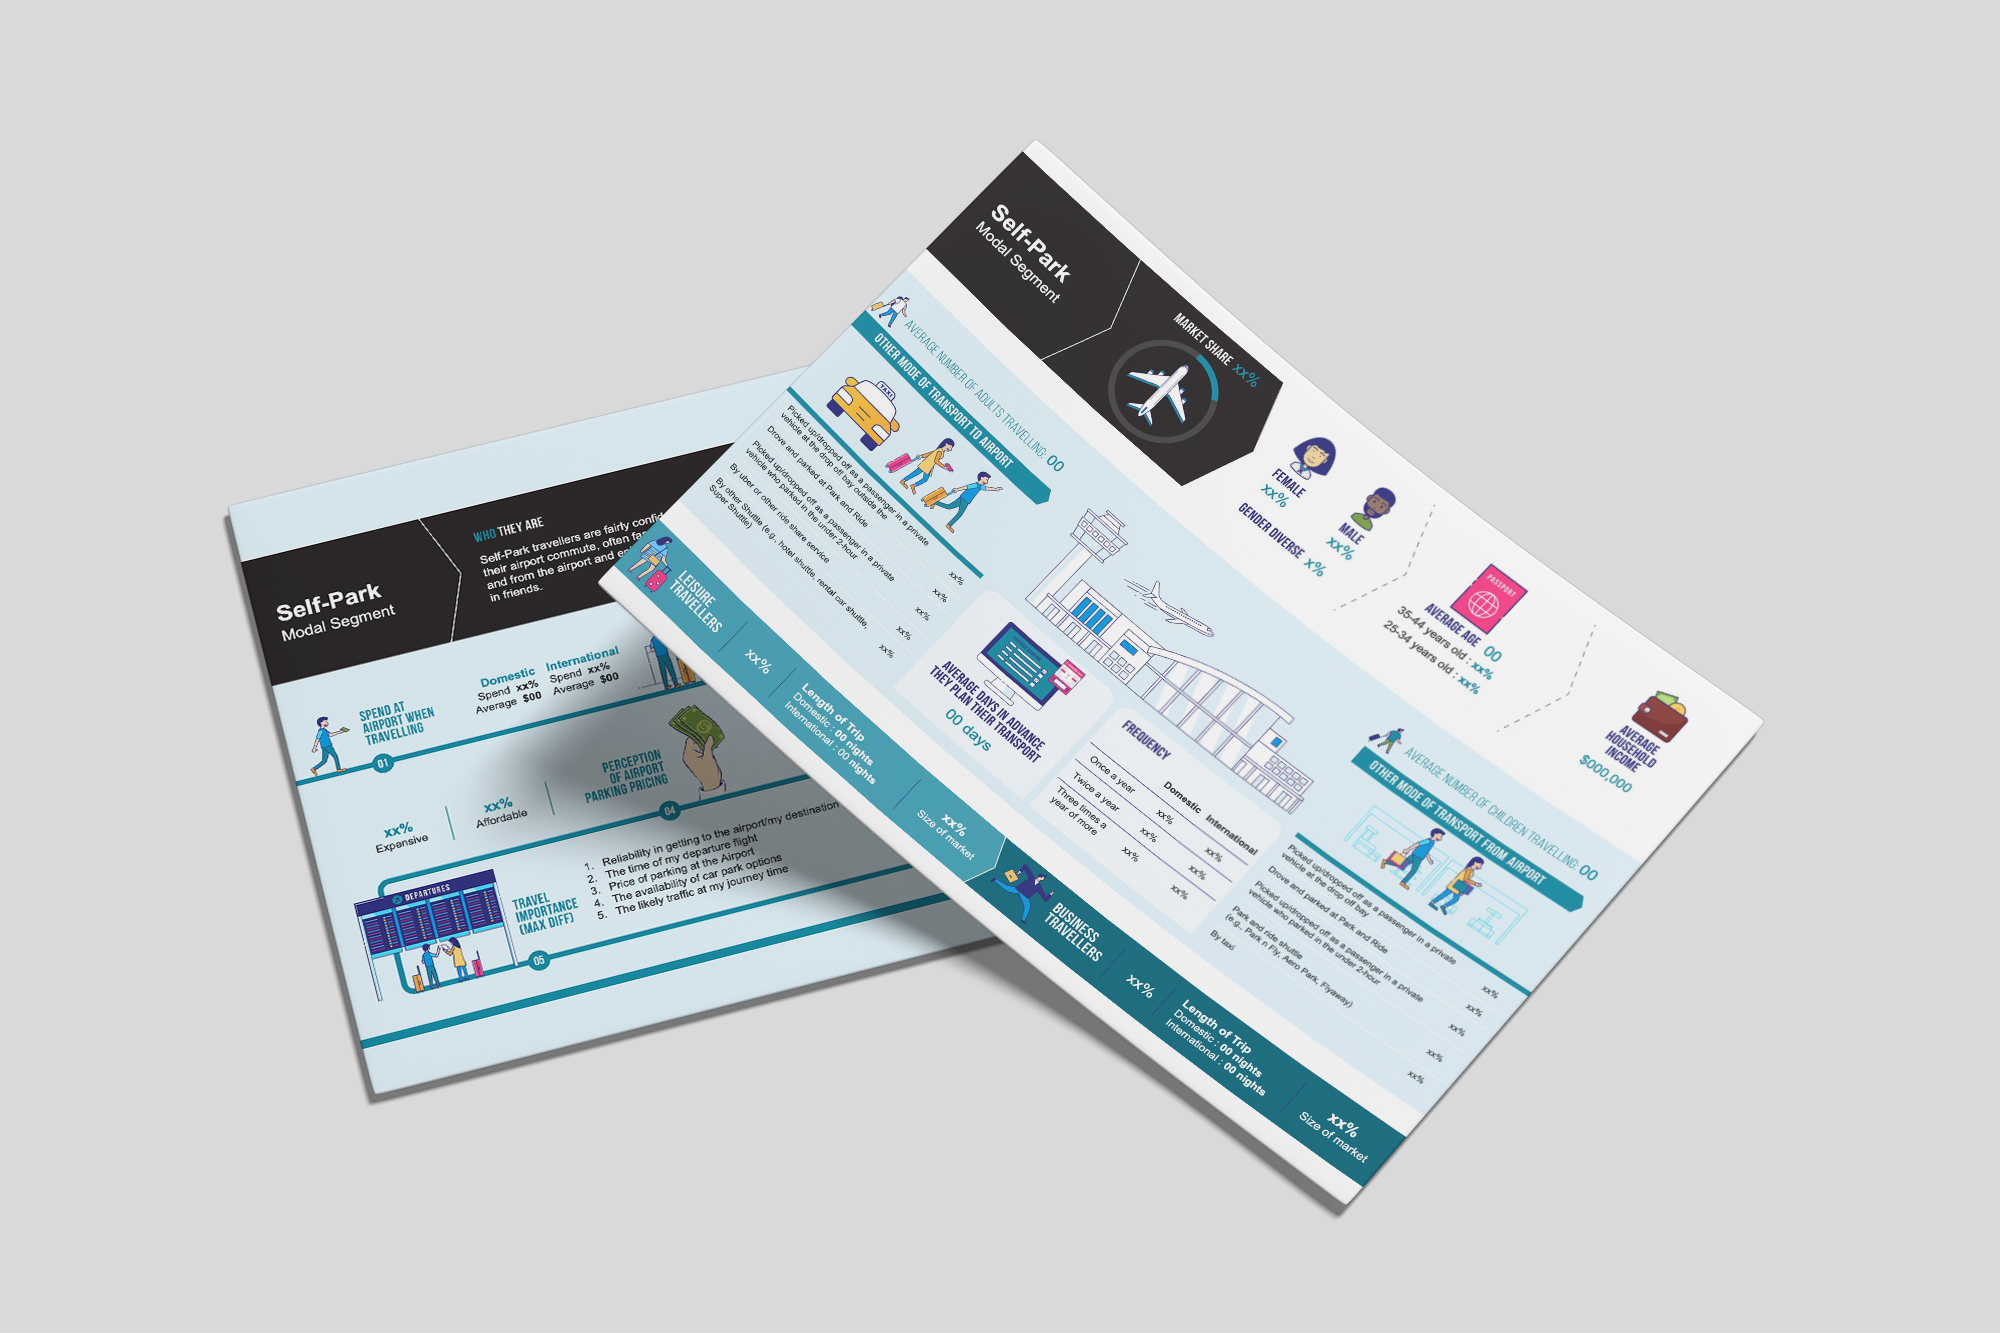
This series of two page infographics was particularly rewarding as I worked with the content creator to choose topics, design the questions and then pull out relevant results to report on. Each issue consisted of a downloadable PDF and some social posts.